Difference between revisions of "Discovery Job"
| Line 66: | Line 66: | ||
===Console Output=== | ===Console Output=== | ||
| − | + | The Console Output is accessible once the job has been completed and will contain only the output produced by the payload, including any error messages. | |
| − | [[image: | + | [[image:jobADDiscovery.png]] |
===Debug Log=== | ===Debug Log=== | ||
Revision as of 08:47, 26 March 2020
| Home > ITOM > Create New Job > Discovery Job | Index |
IntroductionA discovery is run on a designated SIS. The account given within the Admin Credentials will then perform a Discovery based on the method selected. Once a machine is found, the machine will be pinged and then the credentials are further used (using WMI (DCOM/WinRM)) to confirm access to the machine and obtain extra information (e.g. hardware, operating system, installed programs; using EspSisDiscovery) |
Related Articles |
Discovery Job Properties
- Name
- Name given to identify this Discovery Job
- Site Target [Group / Server ]
- whether the job needs to run on a SIS Group or on a single SIS/Managed CI
- Protocol
- The Discovery process once a computer has been identified as a Windows device, Windows Management Instrumentation (WMI) is used to retrieve Windows Information that is used to populate the Inventory. The discovery Job will always be executed directly from the SIS server and thus needs to remotely connect with any computers that it discovers to retrieve their details. There are two methods supported, that can be utilised:
- WinRm
- Provides secure and firewall-friendly communications, in order to access WMI. This feature is supported on Windows 2008R2 and later, Windows 7 and later and later.
- DCOM
- Communication relies on Remote Procedure Calls and can be tricky to configure over firewalls.
- Discovery Mode
- The Discover Mode dictates the method that identifies devices on the Network. Each Mode will have specific settings; these will be visible in the Discover Mode Settings. It is only possible to have a single mode per Job use of multiple modes, will require the creation of multiple Jobs.
- Ping Check Settings
- Ping check Discovered
- [Yes / No] Check that the discovered machine is pinged - if ICMP is disabled or firewalled, then select "No"
- Timeout
- Hop Count
Job Details
Once the job has been created details will be displayed showing information relating to the job including the status of the job. Monitoring, Console and Debug Logging are provided for monitoring the progress and to aid with troubleshooting failures.
- Summary
- Shows the current status of the job and its name along with who created it and when
- Discovery Options
- Displays details of the options used by the discovery process, this will differ depending on the discovery mode that is being used
- Target Information
- Provides details of the SIS server that will facilitate the job, target machine and the security keys used
- Execution Details
- The execution details show when the job was started and completed along with any result code
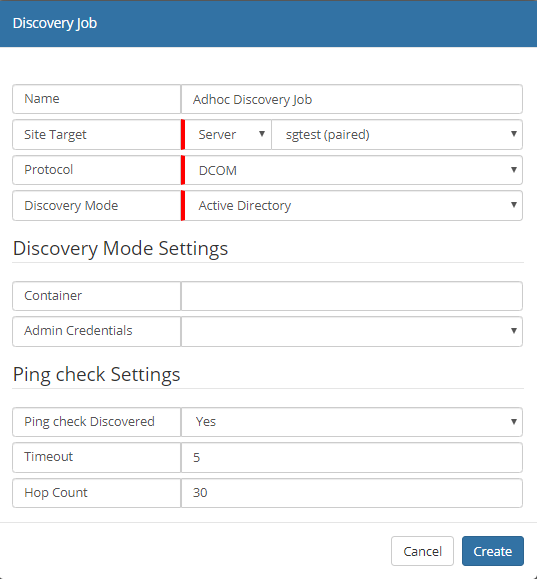
Creating a Job
- Select the Create New button
- Select Discover Job
- Enter Name to identify the Job
- Select an SIS server:
- This can be a single Server or a Group
- Select the required Protocol
- Select the required Discovery Mode
- Enter the relevant Discovery Mode Settings
- Click Create button
Monitor
The Monitor frame provides information relating to the execution of the job; the details shown will be dependant on the method of discovery used.

The above example shows that the discovery has started and has initiated two processes, Standalone (EspSiSExec.exe) and a Payload (ESPSisDiscovery.exe), on the SIS server.
All console output from the process is output, and confirmation of successful completion or failure will be output.
Console Output
The Console Output is accessible once the job has been completed and will contain only the output produced by the payload, including any error messages.
Debug Log
In cases where the package may have failed any error messages that are displayed to the console will be visible here, however, this is may not always be the case and is dependant on the package. In these cases and where further details are required the Debug Log can be used to review more technical details.

The Debug Log frame provides two levels of output "Standard" and "Full". Standard logging provides basic output such as the package details, argument, and command details. Full logging provides further details such as the location of log files, the target computer, encoded parameters, and credentials. The exact content will depend on the package being deployed and its configuration.