Difference between revisions of "Charts"
Jump to navigation
Jump to search
| Line 7: | Line 7: | ||
You can toggle between your Request list view and your [[My Dashboards | My Dashboard]] by clicking on the [[File:MyDashboardIcon.png]] icon when on your Request List view, and the [[File:MyList.png]] icon when on the My Dashboard View. | You can toggle between your Request list view and your [[My Dashboards | My Dashboard]] by clicking on the [[File:MyDashboardIcon.png]] icon when on your Request List view, and the [[File:MyList.png]] icon when on the My Dashboard View. | ||
| − | == Creating Charts == [[File:Charts.png | thumb | 300px]] | + | == Creating Charts == |
| + | [[File:Charts.png | thumb | 300px]] | ||
In order to create a Chart, firstly you must have defined a View on the Request List - Learn more about [[Request_List_Views|Views]] | In order to create a Chart, firstly you must have defined a View on the Request List - Learn more about [[Request_List_Views|Views]] | ||
Revision as of 12:47, 25 September 2015
Home > Service Manager > Request List > Views > Charts
Introduction
It is possible to create one or multiple Charts against each View that you have defined. Once Charts are created they will automatically be added to your personal Dashboard, which will become accessible from a 'My Dashboard' Icon ![]() on the Request list. This Icon will not be visible unless at least one Chart is created against one of your views.
on the Request list. This Icon will not be visible unless at least one Chart is created against one of your views.
You can toggle between your Request list view and your My Dashboard by clicking on the ![]() icon when on your Request List view, and the
icon when on your Request List view, and the ![]() icon when on the My Dashboard View.
icon when on the My Dashboard View.
Creating Charts
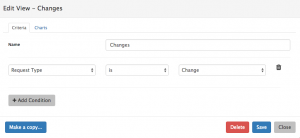
In order to create a Chart, firstly you must have defined a View on the Request List - Learn more about Views
