Difference between revisions of "My Dashboards"
Jump to navigation
Jump to search
| Line 3: | Line 3: | ||
=Introduction= | =Introduction= | ||
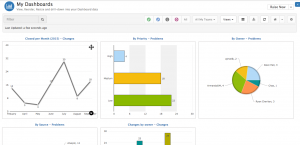
| − | My Dashboards provides each Service Manager user with their own Dashboard. My Dashboards displays charts which have been created against views, and only those which have been marked as visible. The My Dashboards icon [[File:MyDashboardIcon.png]] will only be visible once at least one chart has been created via the Views | + | My Dashboards provides each Service Manager user with their own Dashboard. My Dashboards displays charts which have been created against views, and only those which have been marked as visible. The My Dashboards icon [[File:MyDashboardIcon.png]] will only be visible once at least one chart has been created via the Views. |
* When in the My Dashboard View, all other Menu options are greyed out and not selectable. | * When in the My Dashboard View, all other Menu options are greyed out and not selectable. | ||
Revision as of 08:59, 24 September 2015
Introduction
My Dashboards provides each Service Manager user with their own Dashboard. My Dashboards displays charts which have been created against views, and only those which have been marked as visible. The My Dashboards icon ![]() will only be visible once at least one chart has been created via the Views.
will only be visible once at least one chart has been created via the Views.
- When in the My Dashboard View, all other Menu options are greyed out and not selectable.
- To navigate back to the Request List view, click on the List icon
Managing My Dashboard
- Charts are only visible on My Dashboard if they have been marked as Visible (Configurable from within the charts tab on the Views Configuration)
- My Dashboard displays Charts defined against different Views
Configuring My Dashboard
- Move Chart Widgets around My Dashboard by selecting the 'move' icon on the Chart you wish to move, and then dragging and dropping the Chart into the desired location
- Configure the layout of the Charts, by selecting Small, Medium or Large from the drop down option on each Chart
Drill Down to Chart Data
- It is possible to drill down in the entire data set of the Chart by clicking on the Chart Title. This will take you back to the Request List view and the chart View will be applied.
- It is possible to drill down in to an individual segment of a chart (Pie, Bar, line etc) by clicking on the specific segment of the chart. This will take you back to the Request List view and the data displayed will be that of the Segment of the chart you drilled into
- It is possible to export the data from the Request list view using the Export List icon
- it is possible to clear the chart filter and return to the My Dashboard view by either clicking on the x next to the visible filter or by clicking on the My Dashboards icon
- It is possible to clear the chart filter down and remain on the Request List view by selecting any of the filter icons, view options, or home icon
