Measures
| Home > Administration > Advanced Analytics > Measures | Index |
IntroductionIn order to provide strategic business intelligence through reporting one of the key requirements is to define measures that are sampled and stored periodically. Once these measures are stored over a period of time the type of reporting possible is expanded considerably and include things like trending, performance measurement against goals and thresholds, and predictions based on historical trends.
|
Related Articles
|

Features
Basic Information
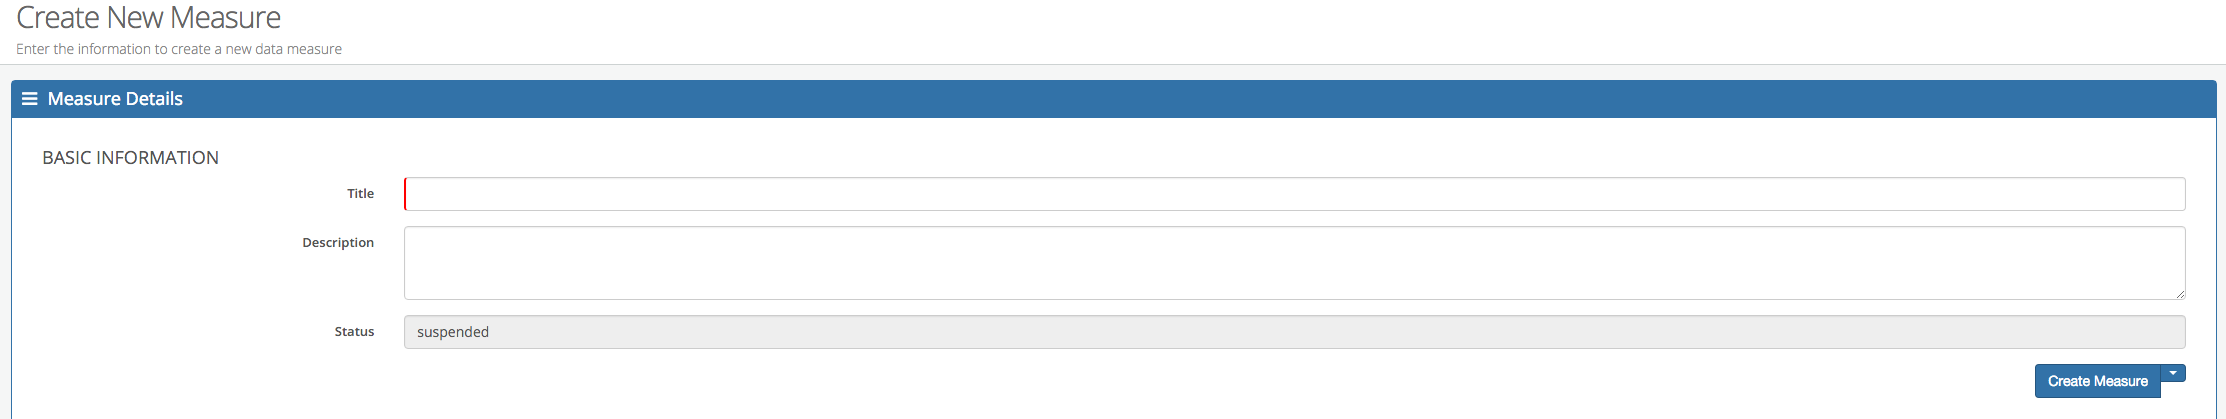
- Title
- The title is visible from withing the list of defined measures. It is also used when creating a widget based on a measure.
- Description
- A details description of the measure can be provided so that other users with the ability to view and edit this measure can understand more about the measure.
- Status
- A "running" measure is currently active and sampling data based on the frequency.
Measure
- Frequency. This is the frequency that the measure will take a data sample. The options are:
- DAILY
- WEEKLY
- MONTHLY
- QUARTERLY (Please choose the starting quarter)
- YEARLY
- Value Aggregate. This is the type of calculation that the measure will perform.
- COUNT - An integer that represents a count of items in a result set that match a specific criteria
- AVERAGE - A numeric value that represents the average value in a series of values in the data set
- MIN - A numeric value that represents the lowest value in a series of values in the data set
- MAX - A numeric value that represents the highest value in a series of values in the data set
- SUM - A numeric value that represents the sum of a series of values in the data set
- PERCENT - A percentage of items in a given data set that match a criteria from a larger subset. For example, the count of records where column X = 5 in a set of records in a given date range, returned as a percentage.
- Scorecard Limit. This is the number of samples that will be shown against a scorecard.
- Sparkline Limit. This is the number of samples that will be shown against a sparkline.
- Maximum Sample History. This is the maximum number of samples that the system will store against this particular measure.
Targets & Goals
- Target Threshold
- This is the count that needs to be achieved in order to meet the measure's target.
- Warning Threshold
- This is the count between the target and the breach thresholds.
- Breach Threshold
- This is the count that needs to be achieved in order for the measure to breach its target.
The direction of the threshold can be changed by clicking the arrow to the right of the threshold targets. In terms of requests or requests logged you would want to say that the lower the number is, the better the teams are performing, however for total number of resolved calls, a higher count is better.
Data Source
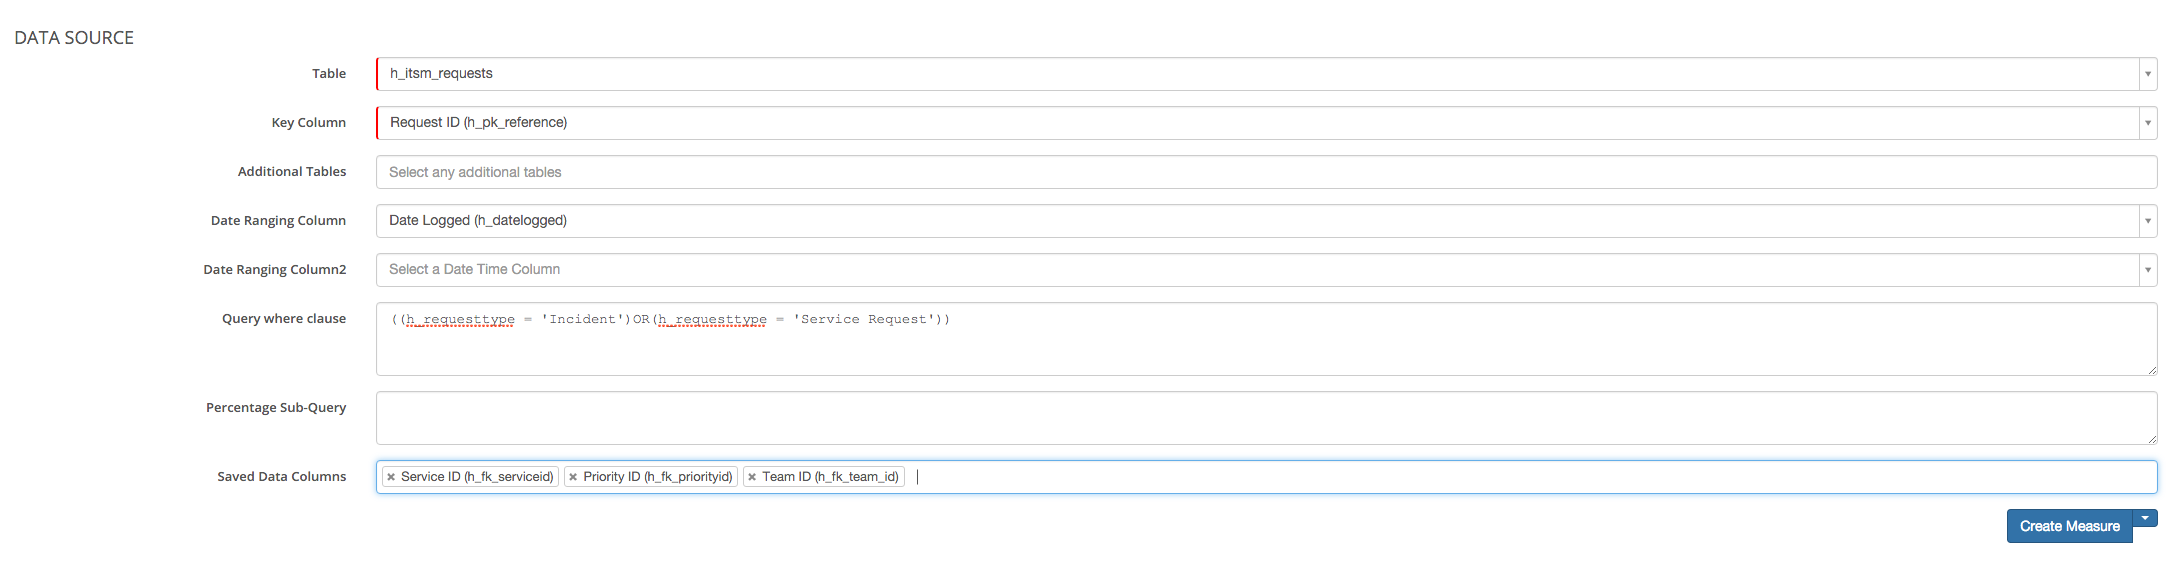
- Table
- This is the primary table from which the measure will collect its data.
- Key Column
- This is the primary key of the named table. Being the primary key, this provides a unique identifier for each record
- Additional Tables
- This is where you would specify any additional tables from which the measure will collect its data.
- Date Ranging Column
- Here you select a date column that the measure will base its data collection on. The dates held in this column will be used to count/sum/average the records based on frequency such as last month, last year or all records since the beginning of this year.
- Date Ranging Column 2
- This is an optional field where you can provide a second date column to be included as part of the criteria for data collection. This will be used to count/sum/average the records where the collected data for the selected frequency will be based on both Date Ranging Column AND Date Ranging Column 2
- Query where clause
- This is where you can add a filter to the measure.
- Percentage Sub-Query
- This is where you can add a percentage filter to the measure.
- Saved Data Columns
- This is where you can specify which column are available to be drilled down on and grouped by. Unless columns are defined against the measure, they will not be available to group or drill down by when configuring widget content based on the measure.
Examples
In this section we will include examples of the different types of Measure which can be defined
- Count - Incidents Logged Per Month