Difference between revisions of "Discovery Job"
| Line 26: | Line 26: | ||
# Click Create button | # Click Create button | ||
[[Category:ITOM]] | [[Category:ITOM]] | ||
| − | + | {{ITOM Job Properties}} | |
== Job Details == | == Job Details == | ||
Revision as of 06:01, 19 May 2020
| Home > ITOM > Create New Job > Discovery Job | Index |
IntroductionA Discovery is executed from a designated SIS server using Admin Credentials provided via the Hornbill KeySafe, using one of the various methods provided. Once all the devices have been discovered, dependant on configuration, a ping request will also be sent to each device. The Admin Credentials are further used for access to each devices Inventory (e.g. hardware, operating system, installed programs) using WMI via DCOM or WinRM. On successful completion, the device details will be stored within the ITOM Inventory and can be identified as managed and the Inventory viewed. |
Related Articles |
Creating a Discovery
- Select the Create New button
- Select Discover Job
- Enter Name to identify the Job
- Select an SIS server:
- This can be a single Server or a Group
- Select the required Protocol
- Select the required Discovery Mode
- Enter the relevant Discovery Mode Settings
- Click Create button
Job Details
Once the job has been created details will be displayed showing information relating to the job including the status of the job. Monitoring, Console and Debug Logging are provided for monitoring the progress and to aid with troubleshooting failures.
- Summary
- Shows the current status of the job and its name along with who created it and when
- Discovery Options
- Displays details of the options used by the discovery process, this will differ depending on the discovery mode that is being used
- Target Information
- Provides details of the SIS server that will facilitate the job, target machine and the security keys used
- Execution Details
- The execution details show when the job was started and completed along with any result code
Monitor
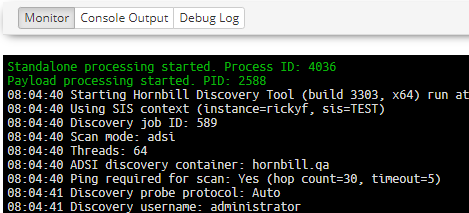
The Monitor frame provides information relating to the execution of the job; the details shown will be dependant on the method of discovery used.
The above example shows that the discovery has started and has initiated two processes, Standalone (EspSiSExec.exe) and a Payload (ESPSisDiscovery.exe), on the SIS server.
All console output from the process is output, and confirmation of successful completion or failure will be output.
Console Output
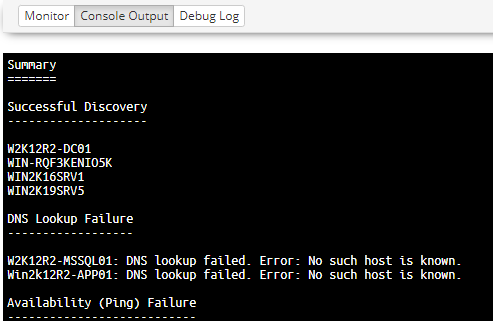
The Console Output is accessible once the job has been completed and will contain only the output produced by the payload, including any error messages.
Debug Log
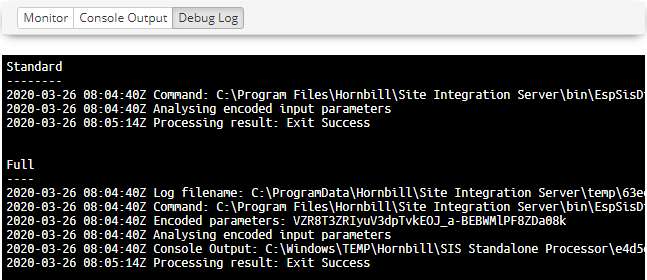
In cases where the Discovery may have failed or completed incorrectly, the Debug log can be used to review any errors and other technical information.
The Log provides three sections:
- Full
- Full debug log information
- Standard
- Information log entries
- Problem
- Warning and Error, entries that may identify portential problems
- The sections output will depend on the job, and thus some sections may not be available


