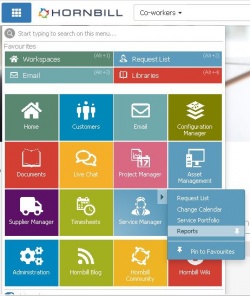
Service Manager Reports
Jump to navigation
Jump to search
The printable version is no longer supported and may have rendering errors. Please update your browser bookmarks and please use the default browser print function instead.
| Home > Applications > Service Manager | Index |
IntroductionThe Service Manager Reports are provided as out of the box, industry standard reports which have been predefined to allow you to inform, analyze, and plan without the complications of report building using technical design tools or query languages. While the hard work is done for you, these reports can still be easily modified and filtered to show just the information you need. |
Related Articles |
Report Categories
Analytics
- Request Connection Count
- Seeing how many connected users there are on a request can indicate the impact of an incident or the interest in a change. At a click of a button get a list of the requests with the most connections.
- Open Requests by Source
- Get a view of where your open requests have originated from. See which source is being underutilized or maybe being used too much!
- Requests Fixed by Change
- In order to conclude an incident or fix a problem, a change request is needed. From this report see which requests are linked to changes.
- Requests Caused by Change
- Something you don't want to see... changes that cause issues. Use this report to identify changes that resulted in the creation of a linked incident or problem with the link relation of Caused by
- Incidents associated to Problems
- This report is grouped by Problem Record, showing each of the Incidents associated to a problem. Get a view of just how much of an impact a problem might be having.
- Incidents associated to Known Errors
- This report is grouped by Known Error. Do you have open Incidents linked to Known Errors? Is your workaround helping resolve these?
Performance
The Performance reports look into the responsiveness and timing against targets. These may be set as part of your Service Levels or just looking to see how well you are doing at providing first time fixes.
- Team Reassignments
- Look to see how many requests have been resolved by the first team that they were assigned to. This can help to identify the performance of your 1st Line teams and if they are successfully resolving requests without having to rely on reassigning to another team.
- Requests Average Response Time by Source
- As requests are raised via different sources see how well the teams are responding to requests raised by email, self service, or other sources.
- Open Requests by Reopen Rate
- Find out how many open requests have been reopened and how many times. Use this report to help determine if requests are being resolved or closed prematurely.
- First Time Fix
- See how many requests are being classed as First Time Fix. This is a great performance indicator to see how many First Time Fixes are being achieved and if the number is low, it might be time to look into ways to increase this.
- Average Incident Resolution time by Service Level
- See how well you are doing against each Service Level. This can be used to help identify where service levels are under performing. Maybe set targets were too ambitious.
Productivity
- Requests with Overdue Activities
- Make sure that your support team are progressing the activities that drive the requests.
Satisfaction
Reports provided in this category are based on the customer Feedback option which can be configured for each service.
- Percent Feedback Requested
- This report is provided to give you an idea of how many requests either include or don't include the requesting of Feedback. While you might be getting good feedback, you may find very few of your requests include asking the customer for feedback. This report is provided to help drive the use of Feedback.
- 10 Lowest Rating Customers
- It can always be a good idea to know who your most unsatisfied customers are. Use this report to quickly find out who they are so you can plan an approach to get them back on track
- Average Rating By Service
- At your finger tips, have a look to see how your services are being rated by your customers
- Response Statistics
- This report provides a look at the status of the feedback which has been sent to your customers. See how many requests are waiting for feedback and have received feedback, or how many requests have had the feedback reach the expiry time or customers have decided not to respond.
Using Reports
- Running a Report
- Download PDF
- Schedule
- Favourite
Custom Reports
- Load View as Conditions
- Order Results By
- Group Results By
- Show Report Criteria
