Service Availability Check
Status Check
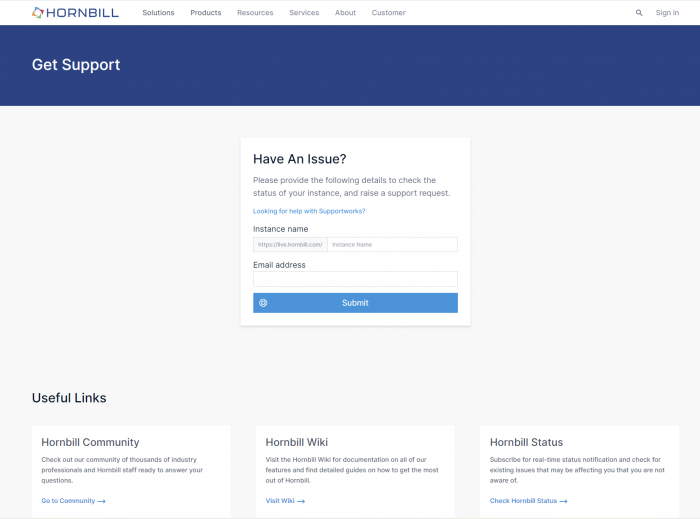
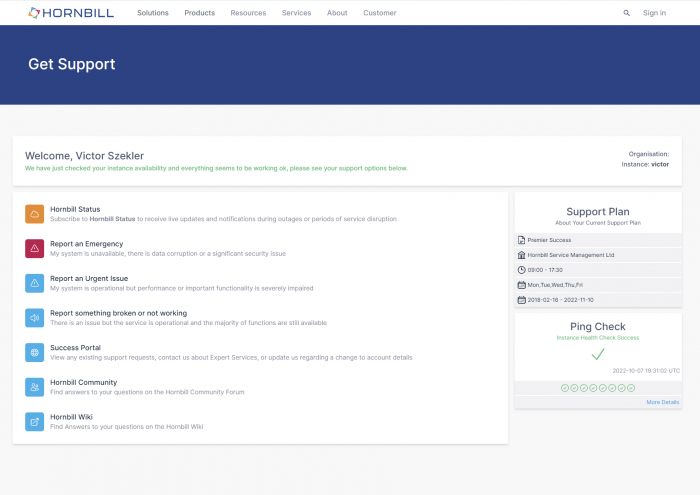
The Hornbill Status Check can be used by any supported contact from an organisation you only need to provide your instance name i.e https://live.hornbill.com/INSTANCENAME/ and your email address if you are a supported contact the page will load your available support options and will start a status check on your instance. The status check is performed client side from your browser giving you an indication of instance performance including any network latency from where ever you are.
Once the Status Check is completed you will either get some Green Ticks and a Health Check Ok message or a Red Mark with an indication of the issue your instance is having, note that our Infrastructure team use the same technology here to constantly check all of our instances and if any issues arise they are notified automatically.
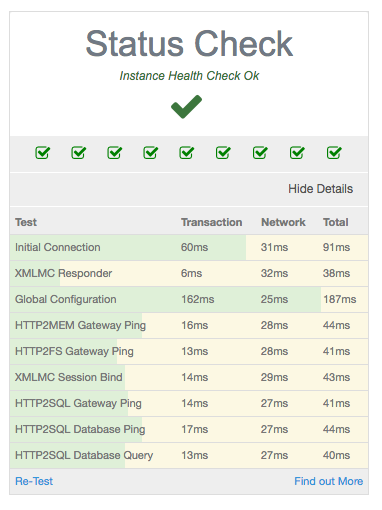
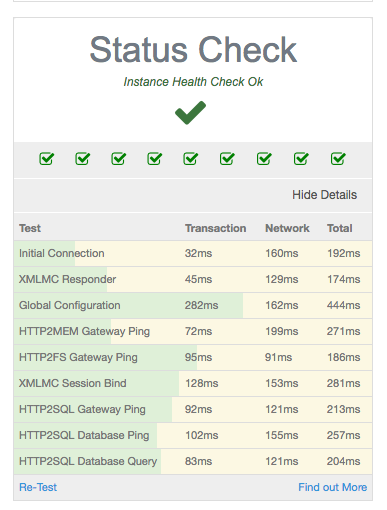
Clicking More Details will expand the Status Check to show the areas that are tested as well as showing additional performance related information.
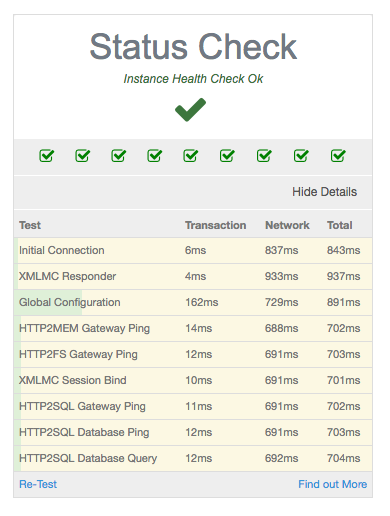
Test - The name of the Test Carried Out Transaction - The total time taken by your instance to complete the rest, this is taken from first receiving the request to sending back the response. Network - This is the total round trip time of the request minus the Transaction time, typically this is the time spend by the request traveling in the network including leaving a customers network navigating the internet to our data centre to an instance and then back again. Typically this time should be fairly consistent between tests. Total - This is the Round Trip time so the total time spend from the browser first making the request to receiving the response.
The coloured bars show a percentage indicator of the total time split into Transaction (Green) and Network (Yellow) , the more yellow in the test then the longer the test took traversing the Network and the more green in the test shows that the test spent longer in the Transaction.
This is an example of a typical test run nothing particularly slow.
This is an example of a very hight network latency the overall test times are quite high and as shown by the large block of yellow and the Network time we can see that somewhere there is Network latency being introduced and should be investigated further.
This is an example of elevated Transactions times this can happen when the instance is under load the times are still in an acceptable range but are higher than the first test which was done with no load on the instance. Its important to note that throughout the day the overall load on your instance will change so the Transaction times can very depending on when they are being run.
