Service Availability
Home > Service Manager > Service Portfolio > Service Details > Service Status > Service Availability
IntroductionAnalyse Service Availability in Hornbill. As the Status changes on a Service from one state to another, information is automatically collected to provide availability metrics. |
Related Articles |
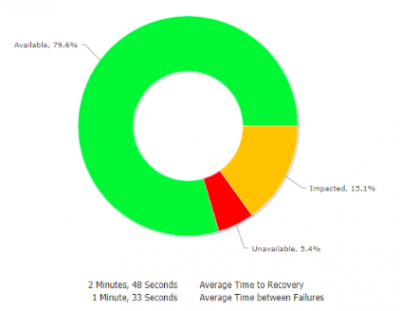
Availability Metrics
- Mean time between failures (MTBF) - The average time between instances of service unavailability
- Mean time to repair (MTTR) - The average time to restore service availability
- Percentage Availability - The percentage of time the service is available
The availability metrics can be accessed using the chart icon next to the service status. At least one change in the status is required in order to view the metrics, and two status changes are needed to show the MTBF metric.
Data
To compliment the availability metrics a full list of all changes in the Services Status (Availability) are recorded and displayed under the Data option.
- Status - The status the Service was sat in (Available, Unavailable, Impacted)
- From - The date and time the Service was in this status
- To - The date and time the Service changed from this status
- Duration - The total time the service was in this status
- Action - Use this option to manually exclude a Status change from the overall Availability Metrics. If a status change was made in error, or testing you may wish to exclude this from the Services overall Availability Metrics.
Filter the Data list to show:
- All Records
- Included Records
- Excluded Records
Date Range
By Default the Availability Metrics will be set to look at the previous 3 months.
- Manually alter the date range to view the Availability Metrics for any given time period.
- Use the refresh icon to return the date range to the default previous 3 month period
SLA
By default the Availability Metrics will be based on a 247 clock, however it is possible to display the Availability Metrics based on the working days / hours of the working time calendar which underpins any SLA which is available on the Service.
Change the SLA to view the Availability Metrics for the Service based on the working hours of the SLA.
Whilst it is possible to add custom service statuses via the servicestatus simple list, the availability metrics are only calculated on changes to the default statuses (Available, Unavailable and Impacted)
