Project Resourcing
| Home > Project Manager > Project Resourcing | Index |

IntroductionProject Resourcing allows those users that are allocated the Project Portfolio Manager role to view the workloads and define the capacity of both individual stakeholders and project teams. |
Related Articles |
Stakeholders
-
The stakeholders tab displays a list of Project Manager users and provides a choice of three views for the selected stakeholder. The first and default view is called the '2 Week Workload' view and displays project tasks assigned to the selected stakeholder in the form of a gantt chart. The second view is of Project Tasks assigned to the selected stakeholder, and the third view is of Projects the stakeholder is a member of.
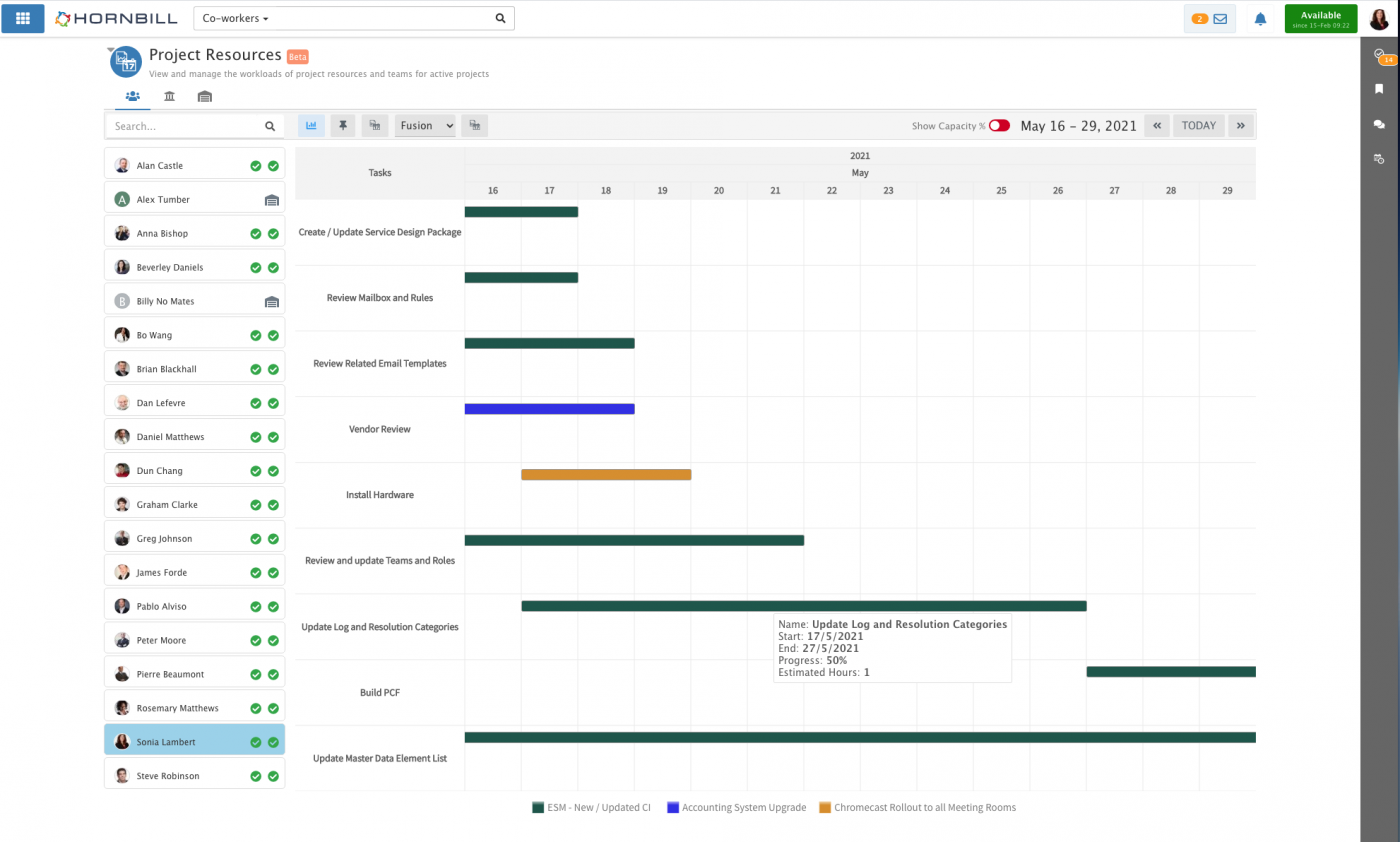
2 Week Workload View
In this view, active project tasks that are assigned to the selected stakeholder are visualised in a gantt chart. Clicking on a task will open its details in a popup window. The tasks are colour coded to the project they are part of. A legend of all projects is available at the bottom of the chart. To see more information about a task without opening it, simply hover the mouse over it.
Capacity
If a capacity record is defined for the selected stakeholder, capacity related information will be available. If no record is defined, you will see a grey warehouse icon. If a capacity record is defined, you can view capacity information in one of 2 views. The first and default view represents the information as symbols (green ticks or red crosses). This is simply to indicate if the selected stakeholder is within capacity or over capacity for the selected period. The first icon represents the first week of the 2 displayed in the gantt chart, and the second icon represents the second week. So for example, 2 green ticks represents being within capacity for both weeks in the period. Hovering over each icon will give you the capacity percentage as a number. If you want to see the capacity percentages themselves, hit the toggle switch on the main toolbar called 'Show Capacity %'.
Clicking on either the capacity icons or the capacity numbers for the selected stakeholder will open a popup window. Here you will find more detailed information on capacity, broken down by each weekly period.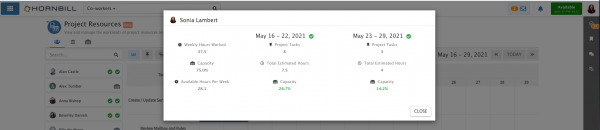
Filters
- Theme - Select a theme for the gantt chart
- Projects - Filter the gantt chart based on selected projects
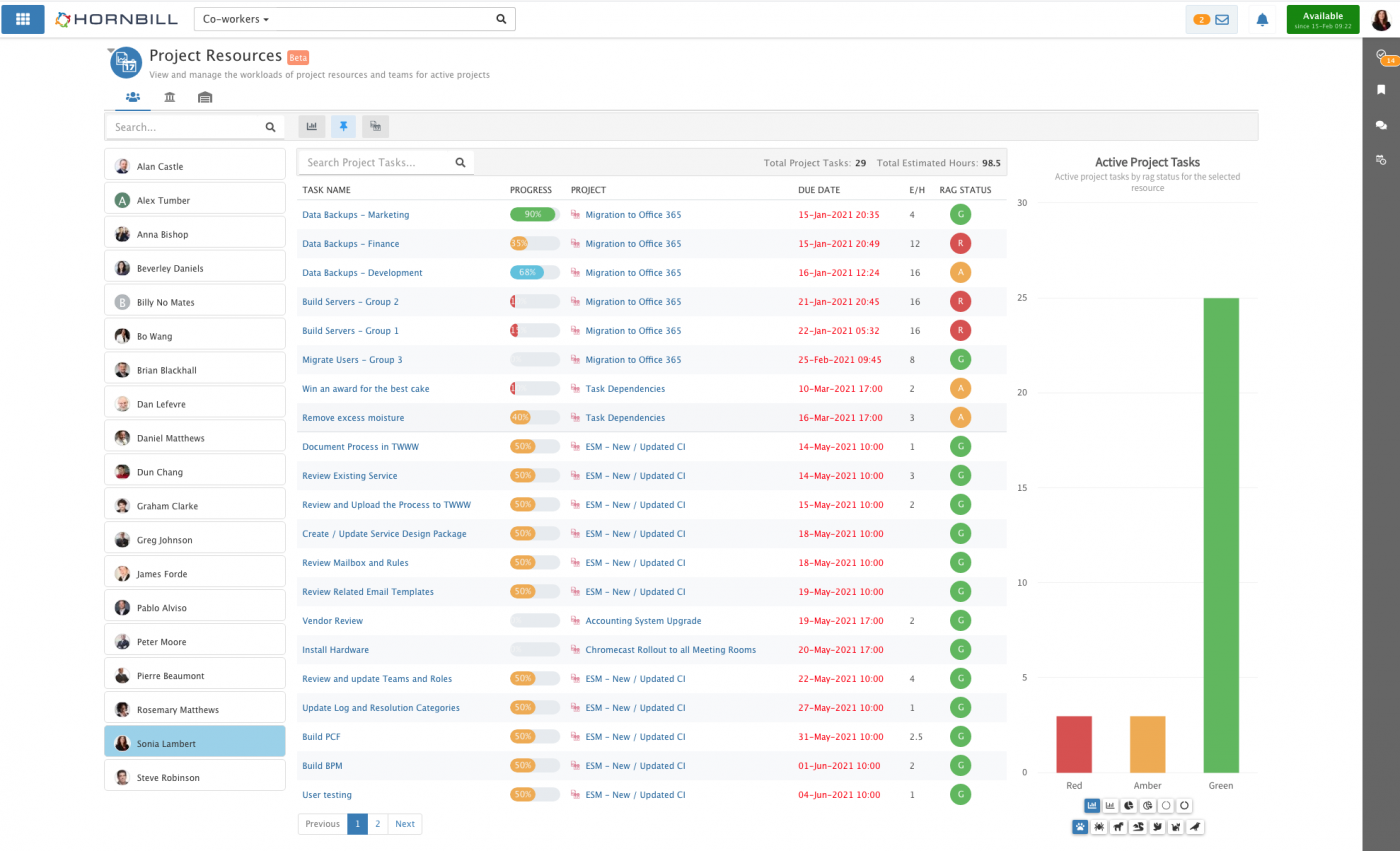
Project Tasks View
In this view, active project tasks that are assigned to the selected stakeholder are displayed in a list. The total number of project tasks and the total estimated time across all of these tasks are listed at the top. The chart on the right breaks down the project tasks by rag status.
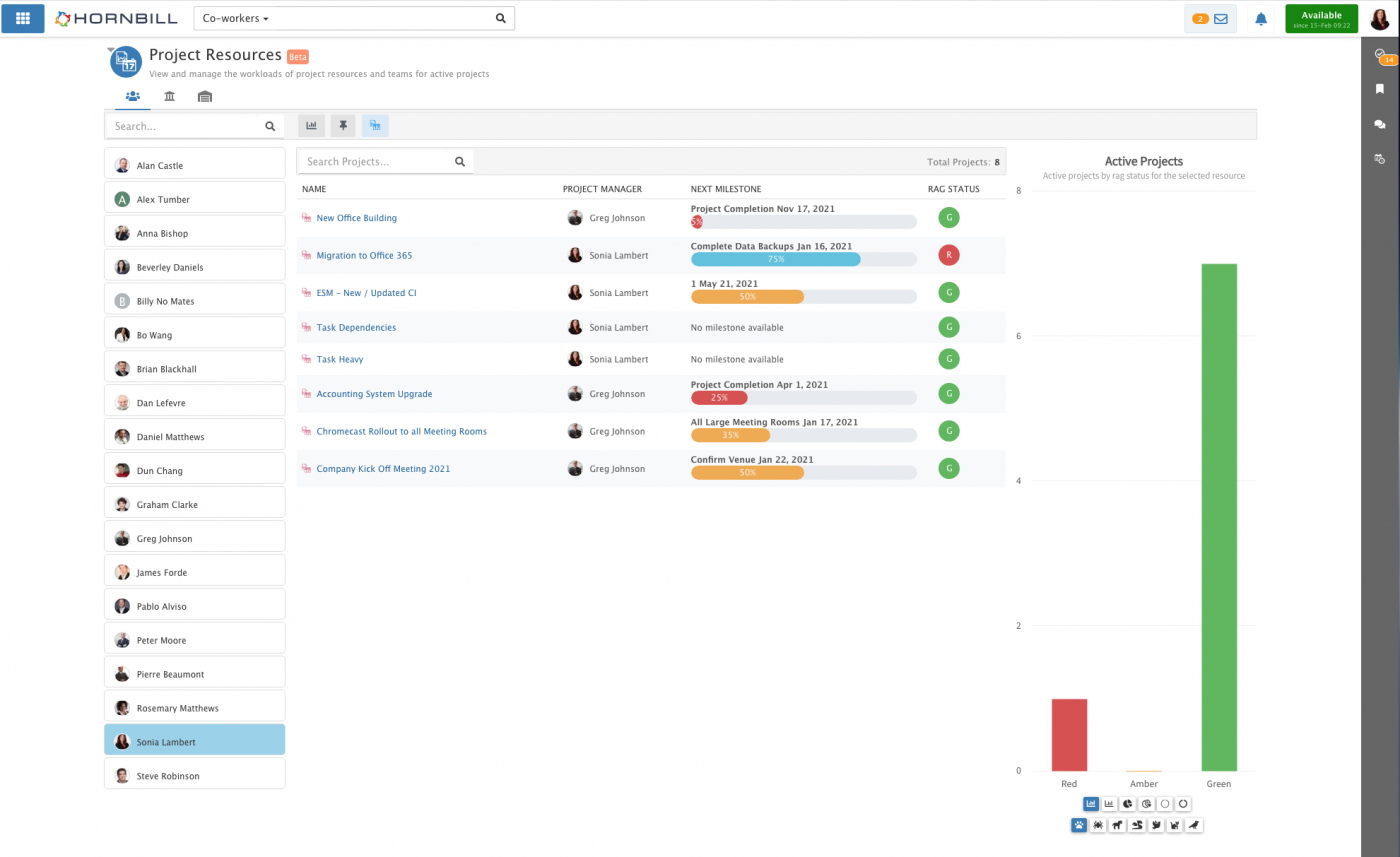
Projects View
In this view, active projects that the selected stakeholder is a member of/stakeholder in are displayed in a list. The total number of projects is listed at the top. The chart on the right breaks down the projects by rag status.
-
The stakeholders tab displays a list of Project Manager users and provides a choice of three views for the selected stakeholder. The first and default view is called the '2 Week Workload' view and displays project tasks assigned to the selected stakeholder in the form of a gantt chart. The second view is of Project Tasks assigned to the selected stakeholder, and the third view is of Projects the stakeholder is a member of.


Teams
-
The Teams tab displays a list of teams that have at least one Project Manager user and provides a single view for the selected team. The view is called the '2 Week Workload' view and displays project tasks assigned to the selected team stakeholders in the form of a gantt chart.
2 Week Workload View
In this view, active project tasks that are assigned to all the stakeholders in the selected project team are visualised in a gantt chart. Clicking on a task will open its details in a popup window. The tasks are colour coded to the project they are part of. A legend of all projects is available at the bottom of the chart. To see more information about a task without opening it, simply hover the mouse over it.
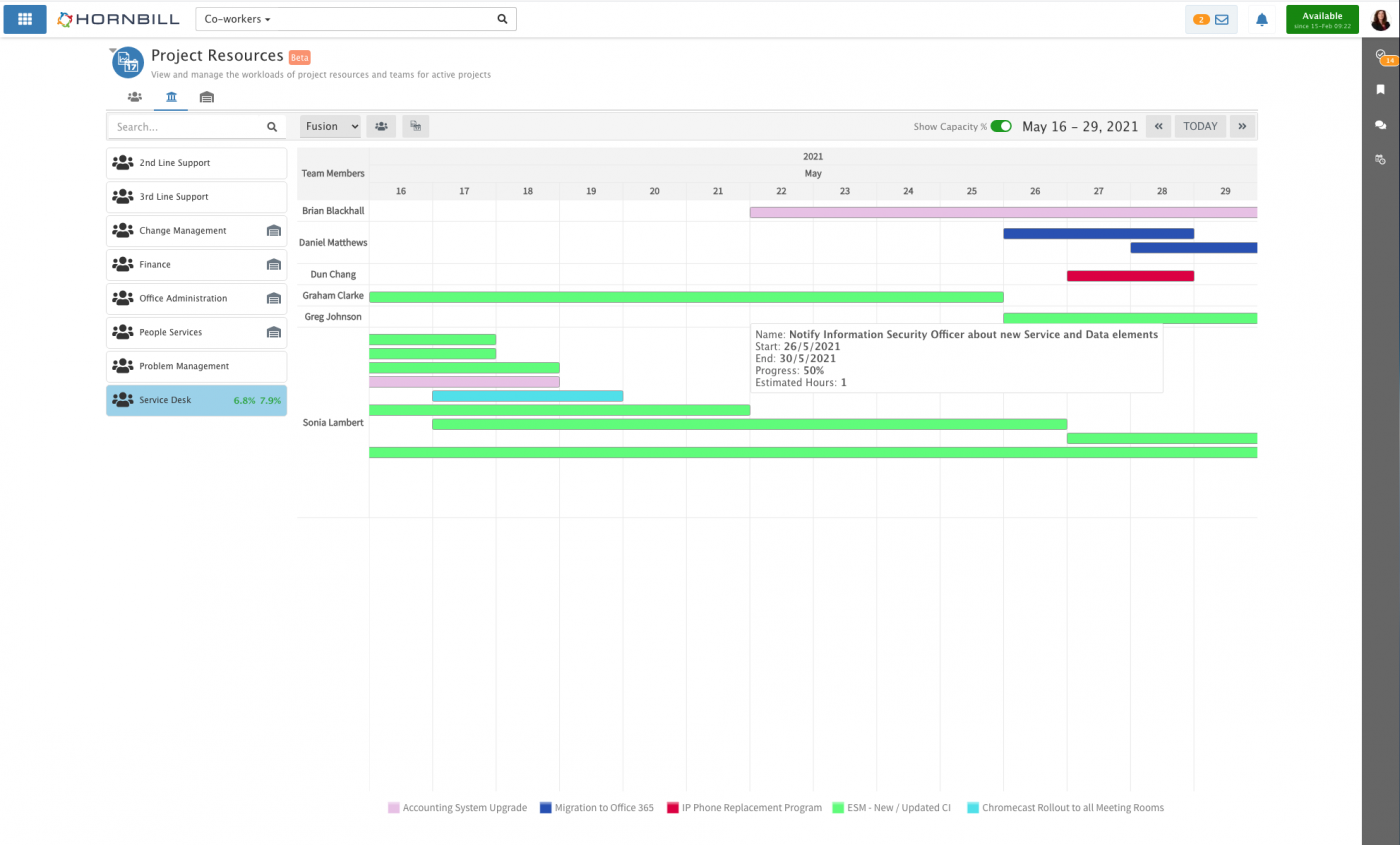
Capacity
If a capacity record is defined for the selected team, capacity related information will be available. If no record is defined, you will see a grey warehouse icon. If a capacity record is defined, you can view capacity information in one of 2 views. The first and default view represents the information as symbols (green ticks or red crosses). This is simply to indicate if the selected team is within capacity or over capacity for the selected period. The first icon represents the first week of the 2 displayed in the gantt chart, and the second icon represents the second week. So for example, 2 green ticks represents being within capacity for both weeks in the period. Hovering over each icon will give you the capacity percentage as a number. If you want to see the capacity percentages themselves, hit the toggle switch on the main toolbar called 'Show Capacity %'.
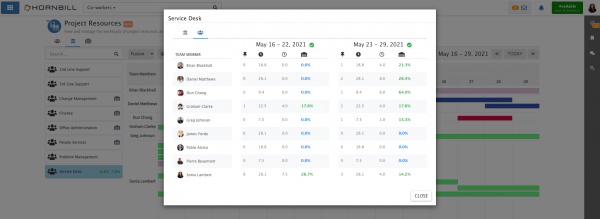
Clicking on either the capacity icons or the capacity numbers for the selected team will open a popup window. Here you will find more detailed information on capacity, broken down by each weekly period in the first tab, and each stakeholder in the second tab.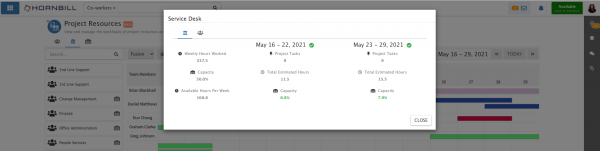
Filters
- Theme - Select a theme for the gantt chart
- Stakeholders - Filter the gantt chart based on selected stakeholders
- Projects - Filter the gantt chart based on selected projects
-
The Teams tab displays a list of teams that have at least one Project Manager user and provides a single view for the selected team. The view is called the '2 Week Workload' view and displays project tasks assigned to the selected team stakeholders in the form of a gantt chart.


Capacity
-
The Capacity tab allows the creation and modification of capacity records for both individual stakeholders and project teams. All capacity records can be modified at any time and there is an automatic audit trail to capture any changes that are made. When creating capacity records, you are required to provide the number of hours worked per week and the capacity percentage for each stakeholder. For each project team, these figures are calculated automatically. Creating these capacity records allows the system to calculate workload percentages based on the estimated time against each project task.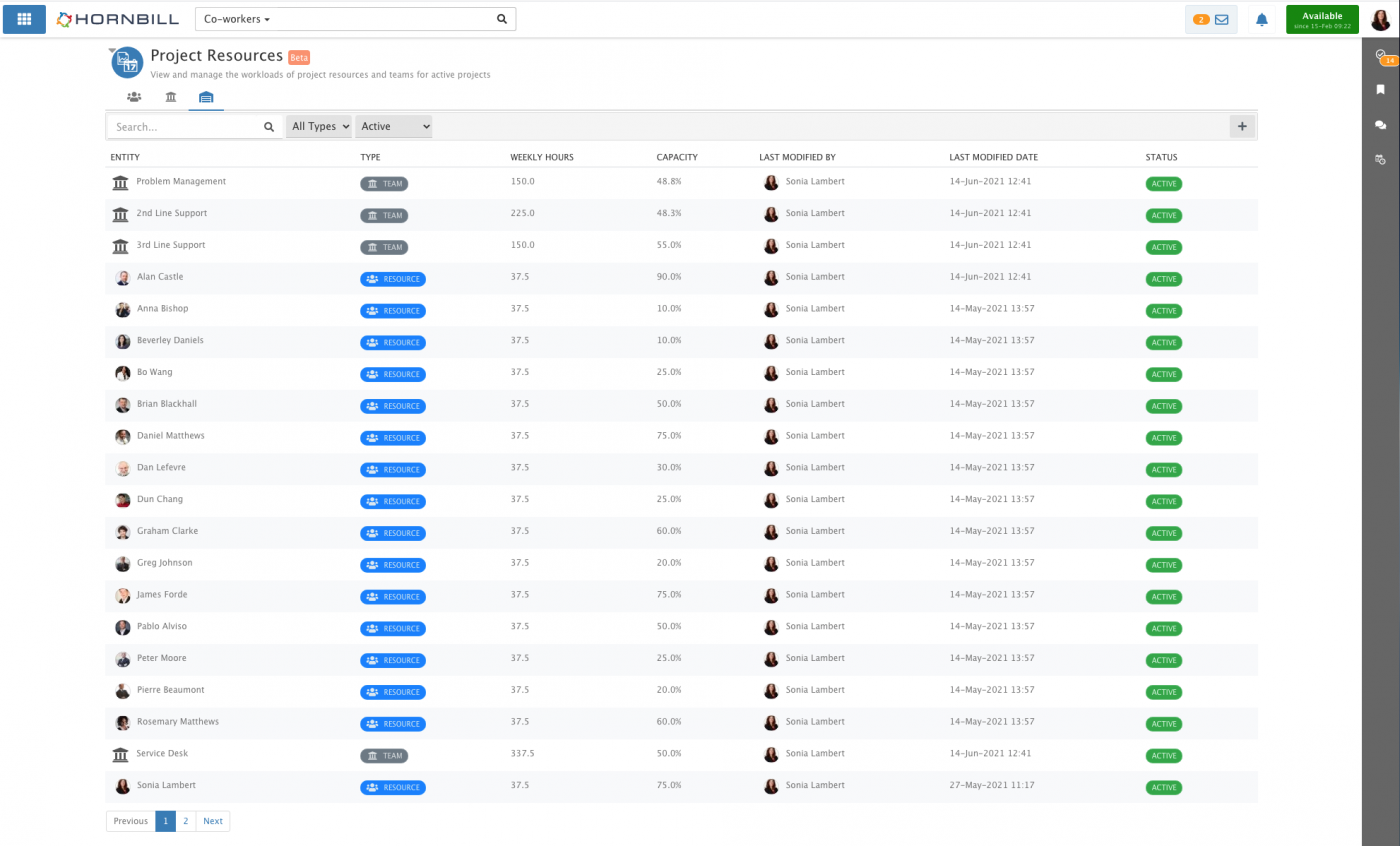
